A weekly activity read on a named coal plant

Stack, cooling-water and coal-pile signatures from imagery, delivered as a series you can chart against your own generation and fuel data.

Spec

GSD
VHR / ≤0.5 m
Cadence
Weekly, one pass per week when the sky allows
Platform
VHR satellite / aerial
Spectral
RGB
Thermal
Yes
Coverage
One named plant per project
Series
Activity index and pile volume, CSV

Files in the delivery

Weekly activity index

Format
CSV column
What's in it
One row per plant per week. Combines the stack and cooling-water reads into a single activity value, with the pass date and the plant ID beside it. Lands in your notebook or time-series database next to load and price.
Cadence
Weekly

Coal-pile volume estimate

Format
CSV column
What's in it
Estimated pile volume for each pass, and the change from the previous pass. The pile is measured from imagery and an elevation model. Treat it as an estimate. It is not a survey.
Cadence
Each pass

Stack and cooling-water signature flag

Format
CSV column
What's in it
A flag per pass showing whether a stack plume and a cooling-water plume were present. Useful for spotting a plant that has stopped, or one that has come back, ahead of the filings. It is a plant-level read, not a unit-by-unit one.
Cadence
Each pass

Pass log

Format
CSV
What's in it
The date of every pass, and every week that was skipped or delayed and why. A gap stays a gap in the series.
Cadence
Each pass

Time-series export

Format
CSV
What's in it
The full series in one file, ready to chart against generation, fuel receipts or price data.
Cadence
Weekly

How it works

  1. In

    Name the plant

    You send the plant name or plant ID and the boundary of the site. We draw the area of interest around the stack, cooling structure and coal yard.

  2. Capture

    Weekly capture

    A very-high-resolution pass over that area each week, satellite or aerial, taken when the sky is clear enough to read.

  3. Read

    Read the signatures

    Stack and cooling-water signs are read on each pass, and the coal pile is measured and differenced against the last pass.

  4. Out

    Series delivered

    You get the index, the pile volume and the flags as CSV, updated each week.

Schematic elevation of a coal plant: stack, cooling tower and coal pile inside a dashed area of interest stackcooling plumepilearea of interest
Fig. 1 What each pass looks at. A drawing, not imagery.

Limits

Condition
Activity, not output
Effect on the series
This reads whether and roughly how hard a plant is running. It does not meter generation. There is no megawatt-hour figure in the delivery, and no capacity factor.
Condition
Cloud and haze
Effect on the series
A weekly pass needs a clear enough view. A blocked pass is skipped or delayed to the next chance, and the pass log says so. Weekly is a target, and a run of cloudy weeks leaves a hole in the series.
Condition
Pile volume is an estimate
Effect on the series
At 0.5 m or finer the pile edges and slopes resolve, but the volume depends on the elevation model and on how the base of the pile is drawn. Small changes between passes can sit inside that uncertainty.
Condition
One plant at a time
Effect on the series
A project covers a named plant. Multiple plants or a full portfolio is a separate conversation.
Condition
Thermal plants with a visible pile
Effect on the series
Scoped for thermal plants that hold a coal pile and show a stack and cooling signature. A plant without a visible pile gets the signature read only. Gas and nuclear plants are not the offer.
Condition
Not continuous
Effect on the series
Each read is a discrete weekly pass. Nothing between passes is observed.

Why this exists

Generation and fuel-receipt numbers reach you well after the coal has burned, and they get revised. In between, the desk works from grid data where it exists, weather, and calls. Nobody can see the pile or the stack from a desk.

So the burn at one plant is a guess until the next EIA release lands, and by then the trade has moved. This is an independent read taken from outside the fence, weekly, ahead of the filing.

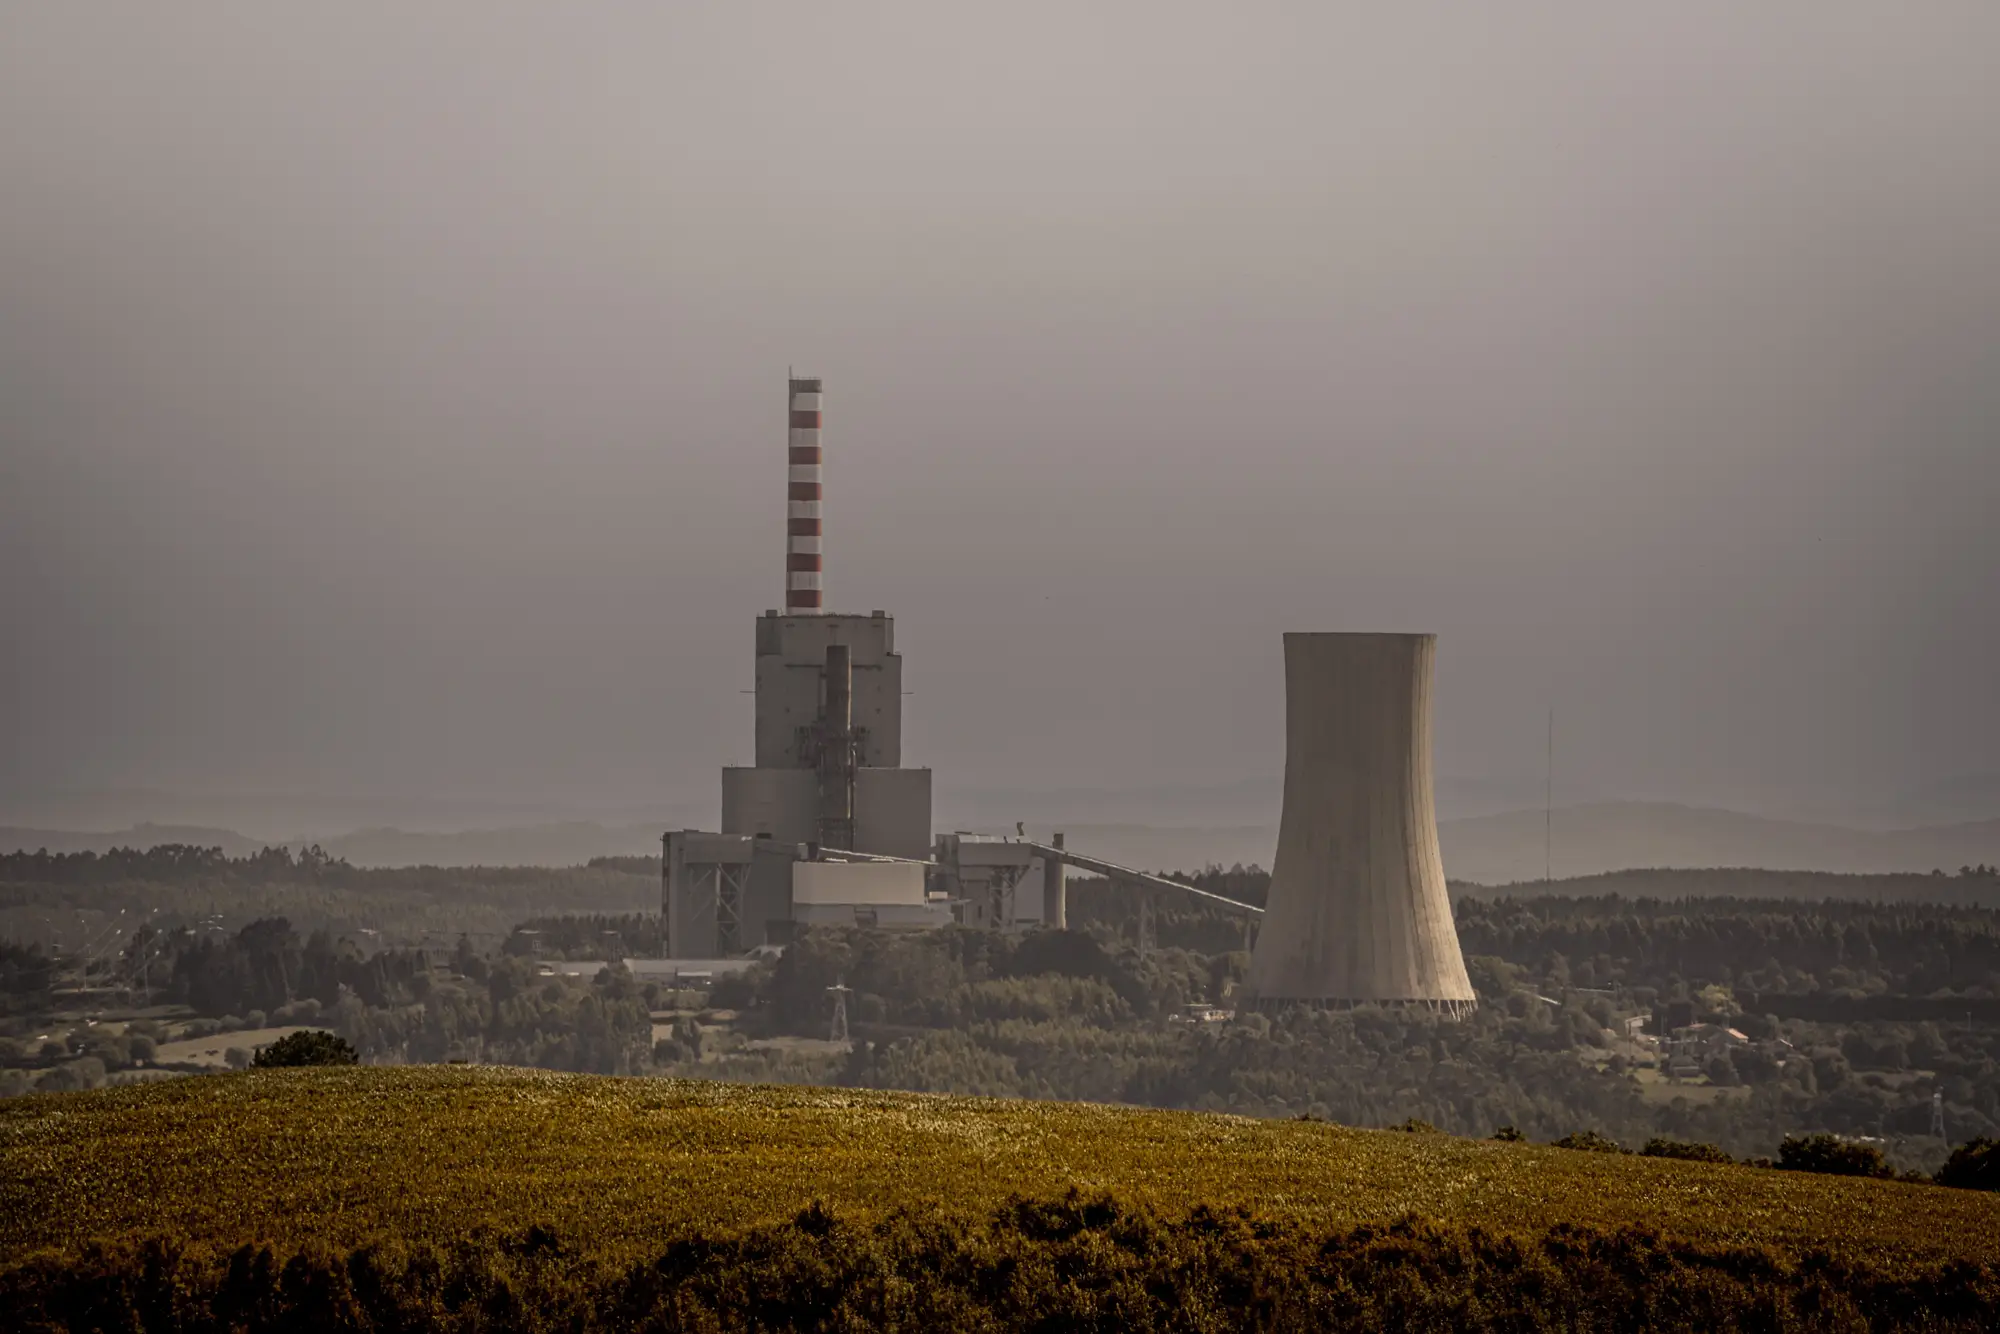
A coal-fired power station with its stack and cooling tower, seen from a hillside on a hazy day
Scenery: a coal-fired station seen from a nearby hill.

Who it's for

Who it's for

  • Commodity analysts on a coal or power desk who want a weekly independent read on one plant.
  • Quant and data analysts who test new series against generation, fuel receipts and price.
  • Fuel-procurement and market-intelligence teams that track a named competitor's or supplier's plant.

Who it's not for

  • Desks that need metered generation or a capacity factor number.
  • Survey-grade stockpile inventory, such as an audit of a pile for accounting.
  • Continuous or intraday monitoring of a plant.
  • Coverage of a whole fleet in one order.

Questions from the desk

Does this give me megawatt-hours?

No. It reads activity signatures and pile volume. It does not meter generation.

How accurate is the pile volume?

It is an estimate, limited by the ground sample distance and the quality of the elevation model. It is not a survey figure, and we do not put an accuracy percentage on it.

What happens under cloud cover?

The weekly pass is skipped or delayed to the next chance. The pass log records it and the series shows the gap.

How do we check it against our own data?

Every row has a pass date. Line it up against your generation, fuel-receipt or grid data for the same plant and weeks. Tell us which reference series you hold when the plant is scoped.

Can you cover a portfolio of plants?

The offer is scoped per named plant. Multi-plant coverage is a pilot conversation.

Do you include gas or nuclear plants?

No. It is scoped for thermal plants, typically coal, with a visible pile and a stack and cooling signature.

Who owns the series and the imagery?

Use terms for the delivered series are written into the contract before work starts. The imagery sources keep their own licences.

How is it priced?

Each plant is scoped and quoted separately. You get a written scope you can take through procurement.

How does it join to our tables?

Each row carries the plant ID and pass date, so the series joins on those in a notebook or database.

Name the plant and we will tell you what the first weeks would look like.

Or .